Chapter 1 eTools
Univariate Data Explorer and Grapher
Histograms, dot plots, boxplots, summary statistics
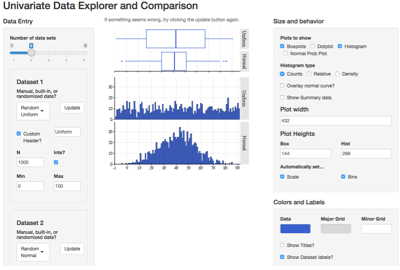
Create histograms, boxplots, dot plots, and normal probability plots for up to five quantitative variables on the same axis for easy comparison. Allows for customization of graph appearance. Enter data manually, use preloaded data from the text, or generate random data using a variety of distributions.
Chapter 2 eTools
Bivariate Data Explorer and Grapher
Scatterplots and linear regression
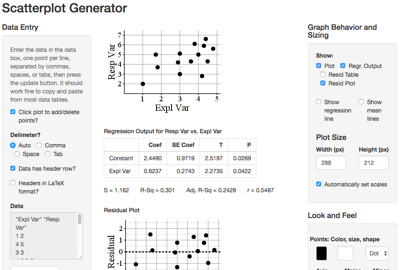
Create customizable scatterplots and residual plots from bivariate data. Perform linear regression on the data. Data can bye typed, copied-and-pasted from spreadsheets, randomly generate points, or added to the graph by clicking.
Chapter 4 eTools
Reaction Time Experiment
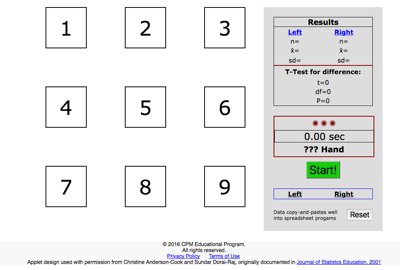
A two-part activity to explore several properties of experimental design. Associated with Lessons 4.2.3 and 11.1.1 of the CPM AP Statistics book.
Blocking Experiment
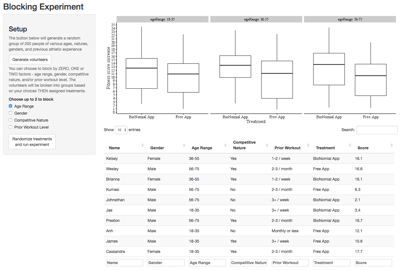
This applet allows simulation of an imaginary experiment involving two exercise tracking apps. By experimenting with different blocking variables, you can see how clever blocking can greatly reduce the variability in an experiment and make results easier to see. Associated with Lesson 4.2.2 of the CPM AP Statistics book.
Chapter 5 eTools
Normal Distribution Explorer
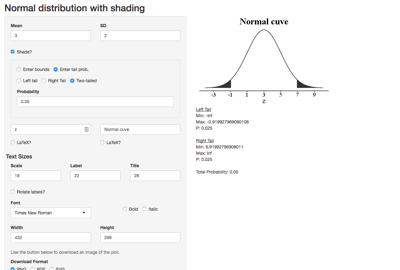
Graph custom, optionally shaded, normal distributions. Find areas under the curve and critical values.
Chapter 6 eTools
Binomial Distribution Explorer
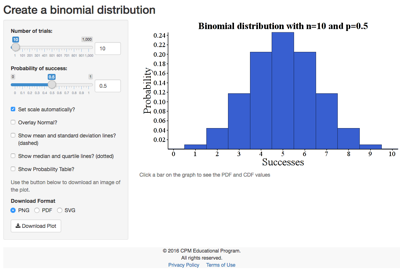
Graph binomial distributions, click for probabilities, and overlay the normal curve.
Chapter 7 eTools
Proportion Sampling Distribution Simulator
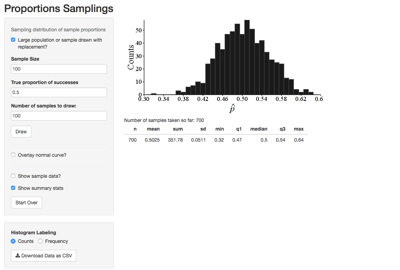
Generate simulated sample proportions from a population of either infinite or known finite size to explore the sampling distribution of the sample proportion.
Proportion Confidence Interval Simulator
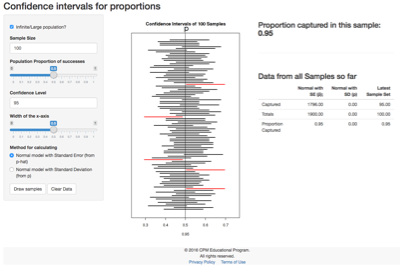
Simulate many confidence intervals for a population proportion using a variety of techniques and parameters and explore the capture rate of the confidence intervals over time.
Errors and Power
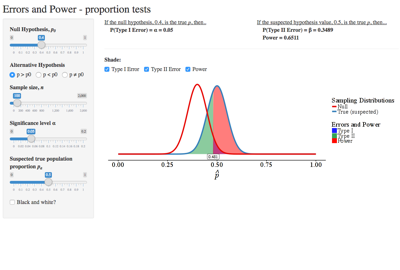
Show the relationship between the "true" sampling distribution and the "hypothesis" sampling distribution for proportion hypothesis tests, and use that to explore the likelihood of Type I and Type II errors and the power of the test.
Chapter 9 eTools
χ2 Distribution Explorer
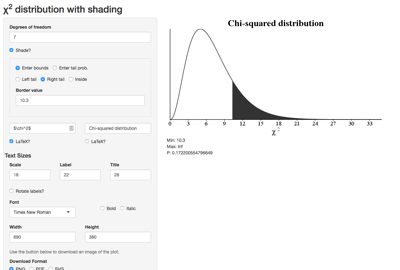
Graph custom, optionally shaded, chi-squared distributions. Find areas under the curve and critical values.
Chapter 10
Quantitative Sampling Distribution Simulator
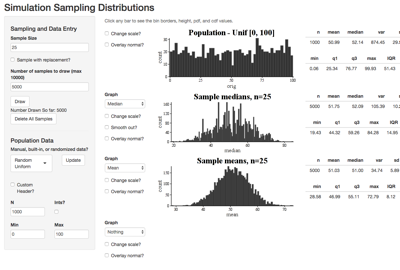
Generate and display sampling distributions of many different quantiative statistics (or even make your own!) from a population of your choice, including a variety of randomly generated options.
Mean Confidence Interval Simulator
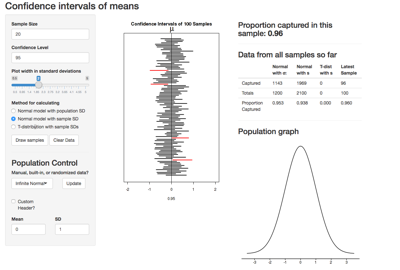
Simulate confidence intervals for a population mean using a wide variety of techniques, from a population of your choice. Explore how different populations and interval techniques affect the capture rate and interval width.
t-Distribution Explorer
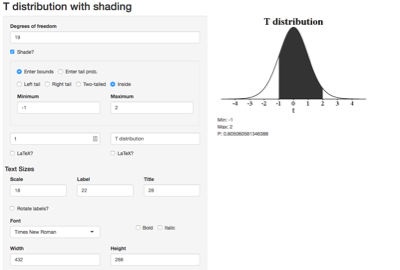
Graph custom, optionally shaded, Students' t-distributions. Find areas under the curve and critical values.
t-Distribution Animation
Observe how the t-distribution changes based on the sample size! (Click for a larger version)
Chapter 13
F-Distribution Explorer
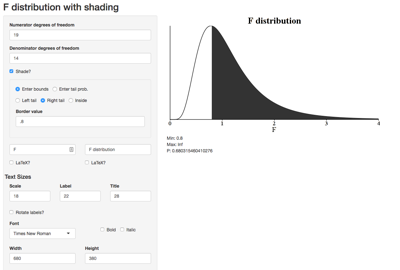
Graph custom, optionally shaded, F-distributions. Find areas under the curve and critical values.